

How brokers can navigate the capacity crunch using SONAR
The SONAR platform offers numerous applications and abundant data to help brokers stay ahead in the increasingly volatile truckload market. Unique datasets—such as tender rejections and volumes—help users recognize when the market is shifting and understand the depth of its impact beyond transactional activity. SONAR also provides robust spot and contract rate data derived from its Trusted Rate Assessment Consortium (TRAC) of brokers and invoice data from Cass.
Users can explore SONAR the traditional way by entering their own tickers into a custom dashboard or take advantage of the preconfigured dashboards already available within the platform. One of SONAR’s greatest strengths is the breadth and depth of its diverse datasets, and dashboards are an excellent way to get an introduction to, and summary of, what’s available.
Step 1: Dashboards and data
The Truckload National Insights page is an ideal starting point for brokers looking to identify where their attention is most needed. This page provides a quick yet detailed overview of what SONAR’s datasets reveal about the domestic truckload market.

Capacity and demand indicators—based on tender data—are positioned at the top of the page to highlight any high-level shifts signaling significant market events. Directly below these indicators is a bulleted summary of actionable insights, which summarizes market conditions and highlights areas that require the most attention.
National spot and contract rate indicators sit below the insights section, providing a clear view of short- and long-term rate trends. Next to these sections is a list of the top 10 markets where volume or spot rates have changed the most over the past week.
Clicking on any market in this list takes you to the Key Market Insights page, where you can examine origin market conditions in greater detail.
At the bottom of the page, you’ll find a heat map showing significant spot rate changes by market. You can toggle between various indicators and review a chart of the National Truckload Index (NTI) and Outbound Tender Rejection Index (OTRI) to quickly identify emerging trends.
Step 2: Rates and negotiating
Once you’ve reviewed the high-level market overview and identified where to focus—or if you’re ready to start quoting and covering loads—the Broker Tool Kit is your next stop.
The Broker Tool Kit includes three primary applications:
-
1. Rate Intelligence (and Batch Rate Intelligence)
-
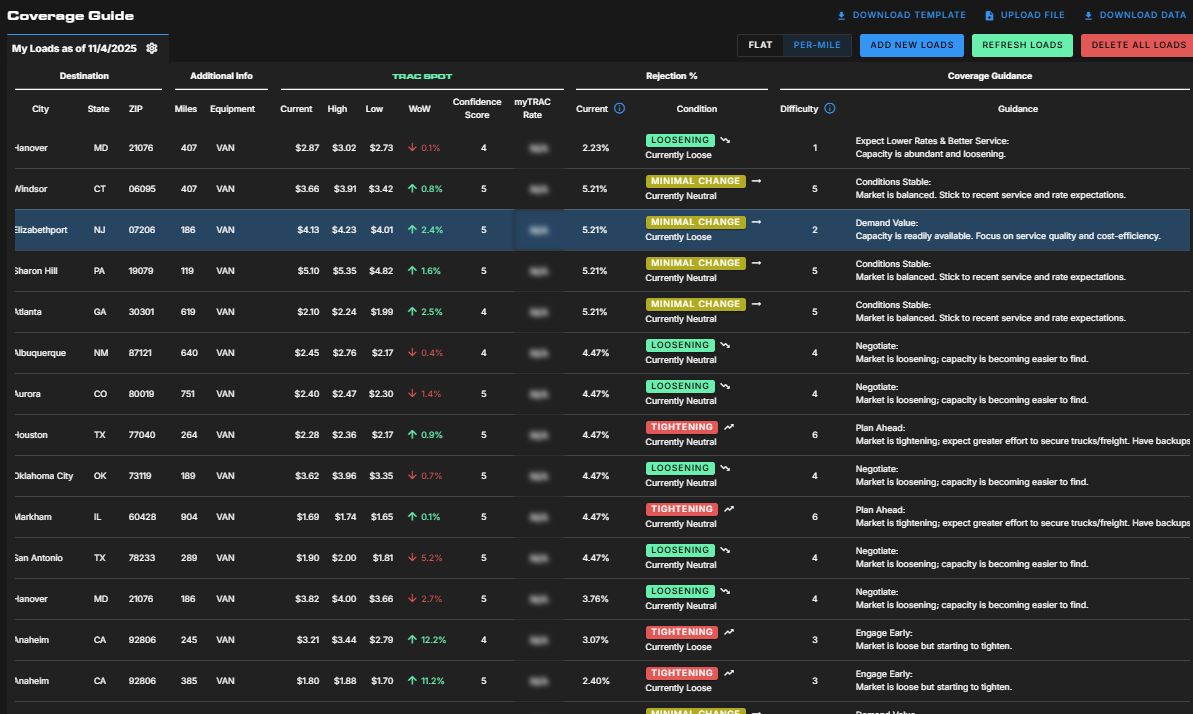
2. Coverage Guide
-
3. Sales Guide
Leave a Comment
Your email address will not be published. Required fields are marked *